The Coverage You Have: Making Traditional Insurance Work — and Where It Stops Working
Most of the conversation about the 2026 healthcare cost shock has focused on the uninsured — the 4.8 million people projected to lose coverage following the expiration of enhanced ACA subsidies. But the larger, quieter story is about the workforce: the roughly 160 million working-age Americans who have coverage, are trying to keep it, and are absorbing costs that have been rising faster than wages for three consecutive years.
This piece is about that group. Not about whether to have insurance, but about what the insurance you have actually costs, where it leaves you exposed, and what the math looks like depending on how you get it. The answer differs significantly depending on whether you receive coverage through an employer or buy it yourself — and that gap is wider in 2026 than it has been in years.
Two Markets, One Workforce
Working-age Americans access health coverage through two fundamentally different systems, and most people only ever see one of them. Understanding both — side by side — is the prerequisite for any honest assessment of what coverage actually costs.
Employer-sponsored insurance covers roughly 154 million Americans under 65. The individual marketplace covers approximately 22 million, the majority of whom are self-employed, gig workers, part-time employees, or people in jobs that don't offer coverage. A third path — Medicaid — is available to lower-wage workers in the 40 states that have expanded eligibility, covering individuals earning up to 138% of the federal poverty level (roughly $20,800 for a single adult in 2026).
The economics of these three paths look nothing alike.
The most important number in that table below isn’t visible in most employees' paychecks: the employer contribution. For a worker with family coverage at a large firm, the employer pays an average of $20,143 per year — pre-tax compensation that the employee receives but rarely factors into their understanding of what coverage costs or what they would face if they lost it.
For the self-employed worker buying on the marketplace, none of that applies. They pay the full gross premium, post-tax, with no employer backstop. In 2026, that gap has widened considerably.
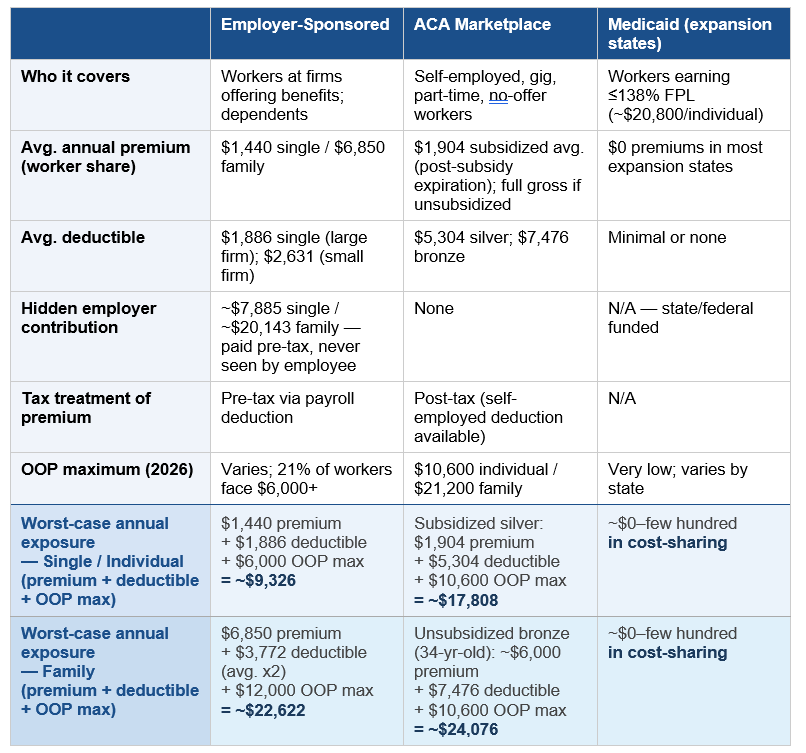
Notes & Assumptions: Employer-Sponsored figures reflect large-firm averages (200+ workers) unless noted. Premium and deductible figures are national averages from the KFF 2025 Employer Health Benefits Survey; individual firm experience will vary. Worker premium share reflects the employee contribution only; take-home impact depends on pre- vs. post-tax treatment.
ACA Marketplace figures are 2026 national averages. The subsidized silver premium of $1,904/year is the post-subsidy-expiration average for subsidized enrollees (KFF, September 2025); individual net premiums vary by income, age, and state. The unsubsidized bronze premium of ~$6,000/year is an estimate for a 34-year-old single adult; actual premiums are age-rated and vary by state. Bronze and silver deductible averages are from KFF analysis of 2026 plan data.
Worst-case annual exposure rows assume: (1) the enrollee meets their full deductible in a given year; and (2) out-of-pocket costs reach the plan maximum. The employer-sponsored OOP max uses $6,000 for single coverage and $12,000 for family — conservative figures, as 21% of covered workers face a single maximum above $6,000 (KFF 2025). The family deductible for employer coverage is estimated at 2x the single average, consistent with standard plan design. These rows represent financial ceilings, not typical annual spend; most enrollees in a healthy year pay premiums plus modest out-of-pocket costs only.
Medicaid figures reflect expansion states (40 states + D.C. as of 2026). Non-expansion states offer significantly more limited eligibility; premium and cost-sharing figures vary by state.
Sources: KFF 2025 Employer Health Benefits Survey (Oct. 22, 2025); KFF, ACA Marketplace Premium Payments Would More Than Double (Sept. 30, 2025); KFF, Deductibles in ACA Marketplace Plans, 2014-2026 (Nov. 6, 2025); KFF, 8 Things to Watch for the 2026 ACA Open Enrollment Period (Oct. 28, 2025).
The HDHP Is No Longer a Choice
A decade ago, high-deductible health plans were positioned as an alternative — a way for healthier, cost-conscious workers to trade lower premiums for higher out-of-pocket exposure. That framing no longer reflects reality. HDHPs are now the dominant plan design in both markets, and for a growing share of the workforce, they are simply what coverage looks like.
33% of covered workers are enrolled in an HDHP in 2025 — the second most common plan type, behind PPOs at 46%, and gaining ground each year.
34% of covered workers face a deductible of $2,000 or more for single coverage — up 32% over five years.
At small firms, 53% of workers face a deductible of $2,000 or more. The average small-firm single deductible is $2,631, versus $1,886 at large firms.
On the ACA marketplace, the bronze plan is functionally an HDHP — with a 2026 average deductible of $7,476 and an OOP maximum of $10,600. For workers who lost subsidies and shifted from silver to bronze, this is a significant and often unrecognized change in what their coverage actually does.
The practical implication is that a large and growing share of the insured workforce is in a plan where the insurance provides limited protection for routine and moderate care.The deductible functions as a coverage gap: until it is met, the enrollee is effectively self-paying at negotiated rates. For the median worker, that deductible represents weeks of take-home pay.
This has a documented behavioral effect. Multiple studies show that patients on high-deductible plans delay or forgo care at higher rates than those with traditional coverage — including preventive care that would reduce downstream costs. The "consumer-directed" theory assumed workers would become better healthcare shoppers. What the data more consistently shows is that they become less likely to use healthcare at all.
The HSA: A Powerful Tool With a Significant Catch
The standard policy response to HDHP concerns is the Health Savings Account. Paired with an HSA-eligible high-deductible plan, workers can contribute pre-tax dollars to an account that covers qualified medical expenses — creating a tax-advantaged buffer against the deductible. The case for this combination is real.
In 2026, HSA contribution limits are $4,400 for self-only coverage and $8,750 for families — both up slightly from 2025. The triple tax advantage (pre-tax contributions, tax-free growth, tax-free withdrawals for medical expenses) is one of the most favorable structures in the U.S. tax code. For workers who can fully fund an HSA, invest the balance, and draw on it in high-cost years, it functions effectively as a dedicated medical savings vehicle.
Recent legislative changes expanded access meaningfully. As of January 1, 2026, all ACA bronze and catastrophic marketplace plans are now HSA-eligible — previously, marketplace plans had to meet specific HDHP criteria. Workers enrolled in Direct Primary Care arrangements can now also use HSA funds to pay DPC membership fees, and telehealth services before meeting the deductible are permanently HSA-compatible.
The catch is liquidity. The HSA only helps if you can fund it before you need it. A worker who enrolls in January and faces a health event in February has a deductible to meet and an empty HSA. The tax benefit arrives at filing; the bill arrives now. And the tax benefit itself is worth more to higher earners: a $4,400 contribution saves roughly $1,540 in taxes for someone in the 35% bracket, and roughly $528 for someone in the 12% bracket — meaning the tool designed to offset higher deductibles delivers its smallest benefit to the workers least able to absorb them.
Employer HSA contributions help at some firms, but coverage is uneven. Only 10% of workers in HSA-qualified plans receive enough from their employer to reduce their out-of-pocket liability below $1,000. For the majority, the HSA is a self-funded account that requires discipline, cash reserves, and enough financial stability to contribute in years when nothing goes wrong.
The Same Plan, Three Very Different Situations
The clearest way to see how market position shapes cost is to run the same framework through three workers — similar age, similar health status, fundamentally different employment situations. For each, we show what coverage actually costs in a healthy year, a moderate health event year, and a worst-case year.
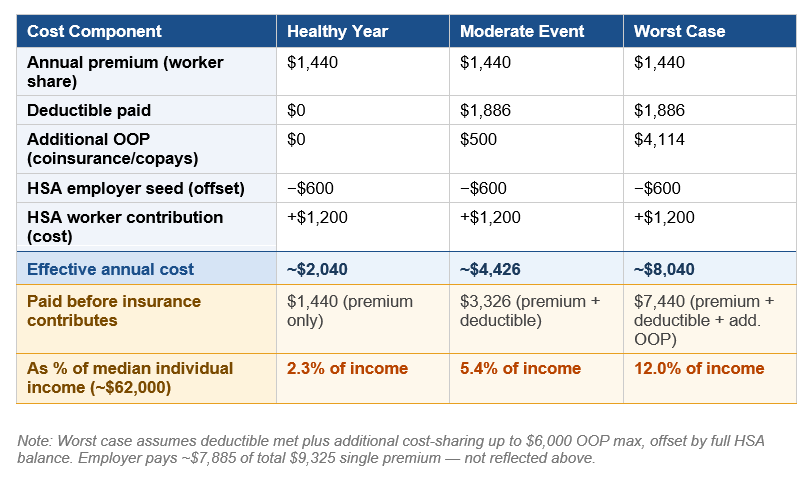
Worker A: Mid-Size Employer, HDHP with HSA
A 34-year-old working full-time at a company with 500 employees, enrolled in the firm's HDHP. The employer seeds $600 into the HSA; the worker adds $1,200 more over the year. The pre-tax premium treatment saves an estimated $360–500/year depending on tax bracket — a benefit invisible to most employees. However, there’s a primary unresolved gap: coverage continuity. A layoff triggers COBRA at the full $9,325 gross premium with no employer contribution, paid post-tax. And in a worst-case year, the individual is left with a bill that represents a significant portion of their salary.
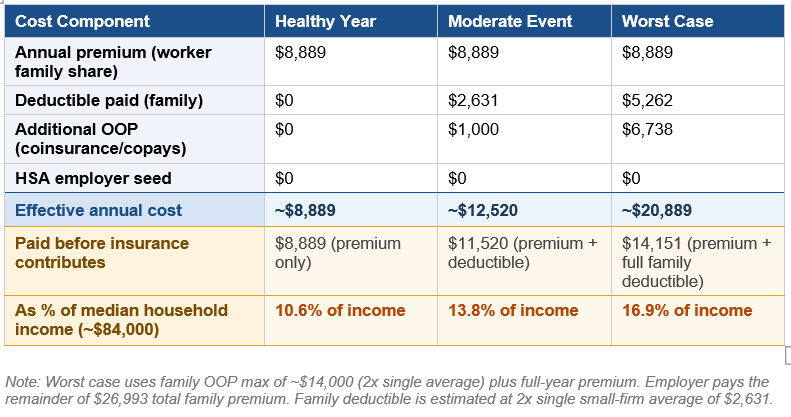
Worker B: Family at a Small Firm
A 38-year-old with a spouse and two children at a firm with 80 workers. The employer offers one plan — an HDHP — with no HSA seed contribution and a lower employer share than large-firm competitors. Even in a healthy year, the family spends nearly $9,000 before receiving meaningful coverage — before a single claim is paid. A moderate health event for one family member (ER visit, specialist, imaging) triggers the individual deductible before the plan pays - building on what already represents a significant cost to the worker. Each subsequent family member resets the clock. For this worker, the primary unresolved gap may be prescription drug costs. Small-firm formularies are thinner. GLP-1 medications and specialty drugs are frequently excluded or subject to high cost-sharing, with no employer HSA buffer to absorb them.
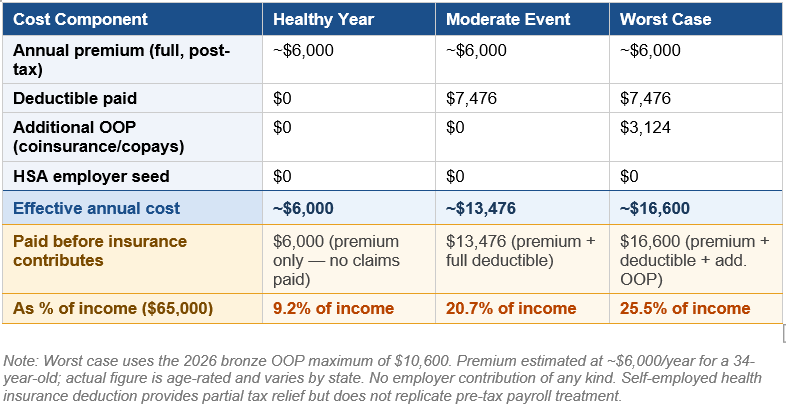
Worker C: Freelancer / Gig Worker, Unsubsidized Marketplace
A 34-year-old self-employed consultant earning $65,000 — above the subsidy threshold at approximately 450% of the federal poverty level. Purchases a bronze plan on the individual marketplace, paid post-tax. In a healthy year, Worker C spends ~$6,000 for coverage that pays nothing (except for preventative services) — the plan exists solely to cap catastrophic exposure at $16,600. Every primary care visit, lab draw, and prescription is a full out-of-pocket cost until the ~$7,476 deductible clears. The financial logic points toward avoiding care. Here, the routine care disincentive is structural, not incidental. There is no HSA seed, no employer backstop, and no affordable path to lower the deductible without moving to a plan with a higher premium.
A Note on Medicaid:For lower-wage workers in the 40 states that have expanded Medicaid, eligibility at incomes up to 138% FPL (roughly $20,800 for a single adult) provides near-zero-cost coverage. But the cliff is sharp: a gig worker whose income edges above that threshold enters the marketplace without a bridge, facing the full cost picture of Worker C. That abrupt transition is one of the least-examined sources of coverage instability in the workforce, and a topic this series will address directly.
What the System Leaves Unresolved
Traditional coverage — employer-sponsored or marketplace — remains the rational baseline for most working-age Americans with moderate or elevated health risk. But making it work increasingly means accepting structural gaps that the plan design was not built to solve.
The primary care disincentive. HDHPs create a financial penalty for using primary care before the deductible is met. Patients avoid or delay visits, including preventive care. The evidence is consistent: this produces worse health outcomes and higher downstream costs.
The moderate-care gap. Catastrophic plans protect against severe events. They offer limited protection for the $3,000–$15,000 range that most actual health events — an ER visit, a specialist referral, an imaging study — actually cost. This is where underinsurance is concentrated.
The coverage continuity gap. Employer-sponsored insurance is contingent on employment. For a workforce with rising rates of job change, gig arrangements, and part-time work, the link between employment and coverage creates recurring exposure that the marketplace — at 2026 costs — inadequately fills.
The equity gap. The HDHP/HSA model delivers its greatest benefits to higher-income, higher-liquidity workers. For lower-wage workers facing the same deductibles with fewer reserves and smaller tax benefits, the architecture that is supposed to make coverage affordable has the opposite effect.
These are not incidental failures. They are features of a system under sustained cost pressure that has progressively shifted financial risk from employers and insurers to workers. The question for the rest of this series is what — if anything — the alternatives being built around and outside traditional coverage actually solve.
Working Through This With Your Organization or Your Family
The cost pressures described in this piece are not abstract — they are showing up in renewal conversations, benefits committee decisions, and kitchen table calculations right now. WellNorth works with both employers navigating plan design decisions and individuals trying to make sense of their coverage options.
What Comes Next
The next pieces in this series examines the real options employers and individuals are weighing as insurance becomes increasingly unaffordable. Some of these options are neither a replacement for coverage nor fringe alternatives — they are a structural response to the most consistent failures identified above. Whether they work, for whom, and at what cost is what we will look at next.
Sources
1. KFF. "2025 Employer Health Benefits Survey." Kaiser Family Foundation, October 22, 2025. https://www.kff.org/health-costs/2025-employer-health-benefits-survey/ — Family premium $26,993; single premium $9,325; worker contributions; deductible data (large and small firm); HDHP enrollment share; employer HSA seed data; GLP-1 drug cost driver.
2. KFF. "ACA Marketplace Premium Payments Would More Than Double on Average Next Year if Enhanced Premium Tax Credits Expire." September 30, 2025. https://www.kff.org/affordable-care-act/aca-marketplace-premium-payments-would-more-than-double-on-average-next-year-if-enhanced-premium-tax-credits-expire/ — 114% average subsidized premium increase; lower-income enrollee premium data; 60-year-old couple example.
3. KFF. "Deductibles in ACA Marketplace Plans, 2014–2026." November 6, 2025. https://www.kff.org/affordable-care-act/deductibles-in-aca-marketplace-plans/ — 2026 silver plan avg. deductible $5,304; bronze avg. deductible $7,476.
4. KFF. "8 Things to Watch for the 2026 ACA Open Enrollment Period." October 28, 2025. https://www.kff.org/affordable-care-act/8-things-to-watch-for-the-2026-aca-open-enrollment-period/ — 2026 OOP maximum $10,600 individual / $21,200 family; HSA eligibility expansion.
5. KFF. "Policy Changes Bring Renewed Focus on High-Deductible Health Plans." January 5, 2026. https://www.kff.org/patient-consumer-protections/policy-changes-bring-renewed-focus-on-high-deductible-health-plans/ — Bronze and catastrophic plan HSA eligibility expansion; DPC HSA compatibility; telehealth permanence.
6. IRS Revenue Procedure 2025-19, May 2025. — 2026 HSA contribution limits: $4,400 self-only; $8,750 family. HDHP minimum deductible thresholds: $1,700 self-only / $3,400 family.
7. Commonwealth Fund. "2024 Biennial Health Insurance Survey." November 2024. — 23% of working-age adults with continuous coverage were underinsured; 57% of underinsured avoided care due to cost. Reported via AJMC and Healthcare Dive.
8. Urban Institute. Projections on 2026 coverage loss from ACA subsidy expiration. — 4.8 million projected newly uninsured; 7.3 million fewer with subsidized marketplace coverage vs. extension scenario. Referenced in KFF and CBO analyses.
9. U.S. Census Bureau. "Income in the United States: 2024." Current Population Survey, September 2025. https://www.census.gov/library/publications/2025/demo/p60-286.html — Median household income $83,730 (2024); median annual earnings for full-time, year-round workers $63,360 (2024). Used as income benchmarks for Worker B (household) and Workers A and C (individual).
10. U.S. Bureau of Labor Statistics. "Usual Weekly Earnings of Wage and Salary Workers, Q1 2025." April 2025. https://www.bls.gov/news.release/wkyeng.htm — Median weekly earnings $1,194 for full-time workers in Q1 2025, annualizing to ~$62,088. Used as individual income benchmark for Worker A income percentage calculations.